Brighton High School
Recent News About Brighton High School
-

Which former Livingston Today area high school standouts will be in action in the week starting Mon Feb. 5?
This former Livingston Today area high school standout will be in action in the week starting Mon Feb. 5.
-

Which former Livingston Today area high school standouts will be in action in the week starting Mon Jan. 29?
This former Livingston Today area high school standout will be in action in the week starting Mon Jan. 29.
-

Livingston County's student body comprised mostly of white students in 2022-23 school year
The most prevalent ethnicity in Livingston County schools' student body in the 2022-23 school year was white, according to the Michigan Department of Education.
-

Which former Livingston Today area high school standouts will be in action in the week starting Mon Jan. 22?
This former Livingston Today area high school standout will be in action in the week starting Mon Jan. 22.
-

Which former Livingston Today area high school standouts will be in action in the week starting Mon Jan. 15?
This former Livingston Today area high school standout will be in action in the week starting Mon Jan. 15.
-

Which former Livingston Today area high school standouts will be in action in the week starting Mon Jan. 8?
This former Livingston Today area high school standout will be in action in the week starting Mon Jan. 8.
-
Livingston County Education: Which school had most students enrolled in 2022-23 school year?
Howell High School stood out with the highest student enrollment in Livingston County, welcoming 2,024 students in the 2022-23 school year.
-

Which former Livingston Today area high school standouts will be in action in the week starting Mon Jan. 1?
This former Livingston Today area high school standout will be in action in the week starting Mon Jan. 1.
-

Which former Livingston Today area high school standouts will be in action in the week starting Mon Dec. 18?
This former Livingston Today area high school standout will be in action in the week starting Mon Dec. 18.
-

Which former Livingston Today area high school standouts will be in action in the week starting Mon Dec. 11?
This former Livingston Today area high school standout will be in action in the week starting Mon Dec. 11.
-

Which former Livingston Today area high school standouts will be in action in the week starting Mon Nov. 27?
This former Livingston Today area high school standout will be in action in the week starting Mon Nov. 27.
-

Which former Livingston Today area high school standouts will be in action in the week starting Mon Nov. 20?
This former Livingston Today area high school standout will be in action in the week starting Mon Nov. 20.
-

Which former Livingston Today area high school standouts will be in action in the week starting Mon Nov. 13?
This former Livingston Today area high school standout will be in action in the week starting Mon Nov. 13.
-

Which former Livingston Today area high school standouts will be in action in the week starting Mon Nov. 6?
This former Livingston Today area high school standout will be in action in the week starting Mon Nov. 6.
-

Which former Livingston Today area high school standouts will be in action in the week starting Mon Oct. 30?
This former Livingston Today area high school standout will be in action in the week starting Mon Oct. 30.
-
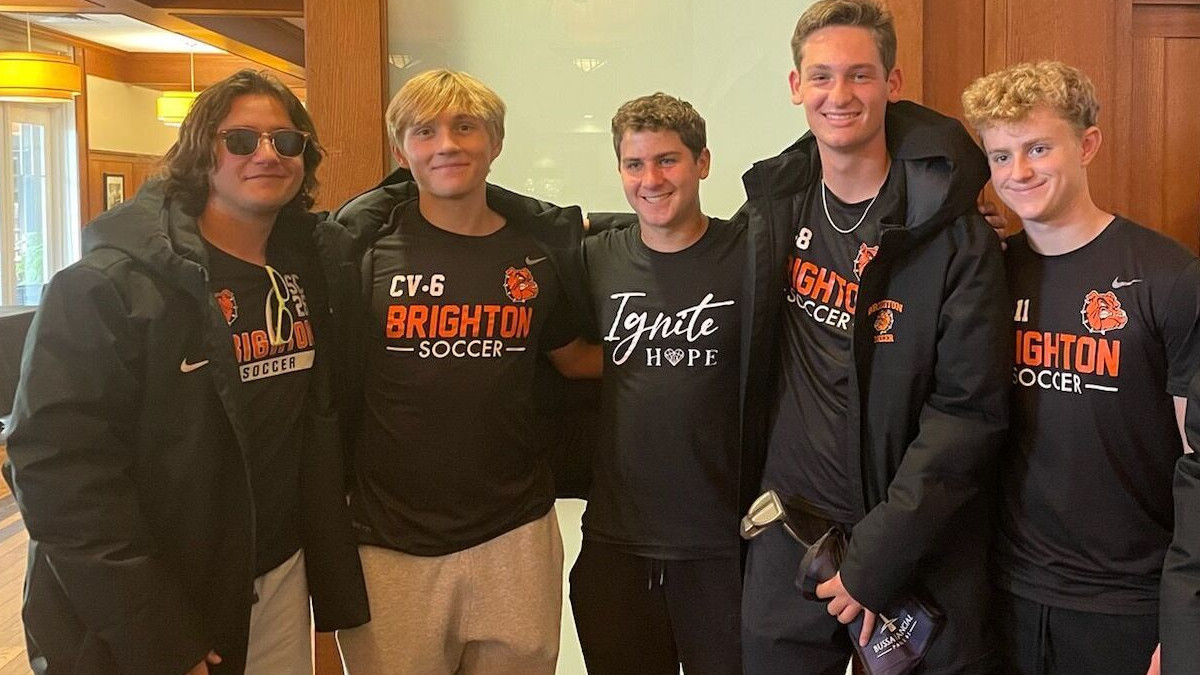
Brighton Area Schools honors high school's fall sports teams: 'Thank you for all your support and everything that we do, especially with all the athletics'
The Brighton Area Schools honored Brighton High School cross country, golf and swim teams at a recent meeting.
-

White students at Brighton High School score 1,086 on average on the SAT (2018-2019)
White students at Brighton High School scored 1,086 on average in the 2018-2019 academic year, a worse result than the average for all students in the school.
-

Students with disabilities at Brighton High School score 858.2 on average on the SAT (2018-2019)
Students with disabilities at Brighton High School scored 858.2 on average in the 2018-2019 academic year, a worse result than the average for all students in the school.
-

Male students at Brighton High School score 1,074.5 on average on the SAT (2018-2019)
Male students at Brighton High School scored 1,074.5 on average in the 2018-2019 academic year, a worse result than the average for all students in the school.
-

Female students at Brighton High School score 1,098.9 on average on the SAT (2018-2019)
Female students at Brighton High School scored 1,098.9 on average in the 2018-2019 academic year, a better result than the average for all students in the school.